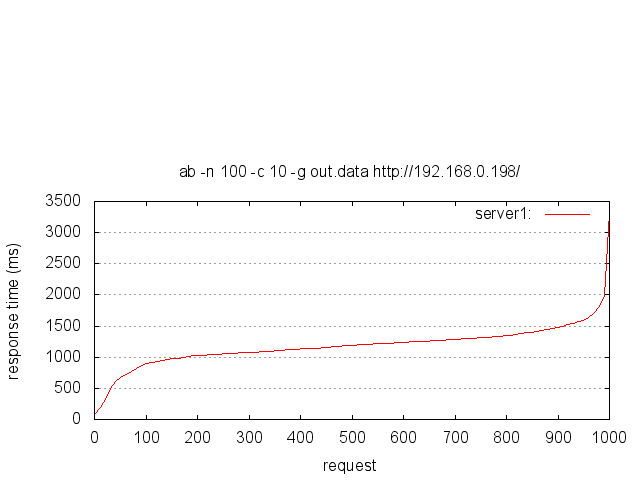
Using gnuplot to plot apache benchmark data
Gnuplot
Gnuplot is a portable command-line driven graphing utility for various platforms like Linux, OS X, Windows and many more. It’s free to use and was originally created to allow scientists and students to visualize mathematical functions and data interactively.
Installing Gnuplot
If you don’t allready have gnuplot installed then first intall it. On mac:
brew install gnuplotOn linux:
sudo apt-get install gnuplotConfigure Gnuplot
This tutorial requires that you have already created a benchmark test. If you haven’t you can read here how to create an apache benchmark performance test. After installation, you can then create a file to graph the data you’ve created:
vim apache-benchmark.pIn the file, put the following:
# output as png image
set terminal png

# save file to "benchmark.png"
set output "benchmark.png"

# graph title
set title "ab -n 1000 -c 50 -g out.data http://192.168.0.198/"

#nicer aspect ratio for image size
set size 1,0.7

# y-axis grid
set grid y

#x-axis label
set xlabel "request"

#y-axis label
set ylabel "response time (ms)"

#plot data from "out.data" using column 9 with smooth sbezier lines
plot "out.data" using 9 smooth sbezier with lines title "something"
Visualize your apache benchmark performance test
Next run the gnuplot command to create the image
gnuplot apache-benchmark.pThat’s it, you can then open the image for visual inspection.
open benchmark.pngPerformance test example


